SharePoint ULS Log analysis using ELK (ElasticSearch LogStash and Kibana)
A Solution to Multi-Tenant systems Log Access.
By: George Gergues
Introduction
SharePoint is a large platform that is always growing, and changing, and as with large application platforms that hosts many components, the complexity is always manifested in the platform log (ULS Logs) and log management. There are several ways to trace and debug issues using those logs, and tooling in this area has not been keeping up with the speed SharePoint. The other major complexity is multi tenancy, as the cost to own and operate a single SharePoint farm has been on the rise, many companies started to offer a multitenant farm system, mainly Office 365 by Microsoft, along with other hosting vendors in the same domain. Multitenancy reduces the cost of owning into a cost to lease or operate, but takes away platform specific facilities like Audit Log and platform log, as those log containers are not partitioned at the same tenancy level but are singletons per host in the case of ULS Log or per Content Database in the case of Audit Log table.
The Solution
 In this posting we are proposing the use of the ELK platform (ElasticSearch, LogStash and Kibana) as a tool to ingest the ULS logs, leverage the fast index and search capabilities and make use of the event correlation features that come by aggregating logs and other factors.
Such tool used by system engineers and hosting staff can be very useful in responding to first level support incidents, or to relay the events to the end user without compromising security.
Document level links: The system engineer can share a document level link, to the event to show the full details of the event, those are mainly
Also this tool can show trending of events and repeated problems or patterns that might be cyclical in nature and provide better picture of farm level performance and common problems.
With little development, you can expose those search portal to the end users to directly perform those tenant level searches without exposing the full log to the end user or tenant admin.
The next few sections will show in detail how to build and customize such system.
What is ELK
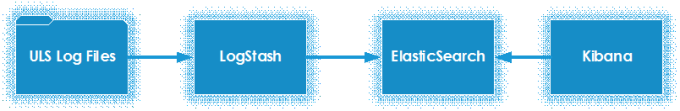
ELK = [ E + L + K ]
ELK is the combination of three open source solutions to three problems and merged together, they form the best solution for large log and large dataset analytics. All three systems operate using REST.
E: ElasticSearch:
Index and search server base on the Lucene open source project, storing documents based items (JSON objects), the storage is clusterable and highly redundant through shards and multiple distributed nodes. Elastic Search is the Java ported version of Lucene and runs inside a JVM.
L: LogStash
is a Log capture and processing framework that works in a Capture-> Process -> Store cycle per single event on the log source. It is open source project that evolved a lot in the past year to operate with a long list filters, modules and plugins. LogStash is very powerful when used to construct schema JSON documents from unstructured text inside log files using GROK filters. LogStash is written mainly in Ruby and running inside JVM using JRuby.
K: Kibana
is a “node.js” data visualization layer that is tightly integrated with the elasticsearch index and can build charts and dashboards that represents data in the elastic search index very fast. It is making use of the fast REST api and is very responsive inside the browser even with large datasets. The Kibana configuration is stored as a JSON document in the elastic search index, along with all the charting and dashboard scripts that it produces.
The Challenge
-
Multitenancy
As mentioned in the introduction, with multitenancy comes the lack of access to platform ULS logs due to security restrictions to OS Filesystem level. The only way SharePoint shows application and system exceptions is via a custom application error pages, and they are very obscure, normally assigned a session or transaction id ( uuid ) named (correlation Id)and that is the only piece of information the user gets along with the timestamp.
Example of Correlation Id “53fed7f1-cf35-1253-0000-000050f7b00c”
Cannot give all tenants access to the shared logs as they main contain information regarding custom application or extensions, it might also expose other tenants content or exceptions depending on the debug level.
-
Log Size and Log Cycling
The other problem is Log Sizes and Log cycling. As with any large enterprise deployment, you are required to maintain some weeks of log history, either on the same system or offline. The minute those files leave the system, they are harder to manage and /or correlate.
-
Multi Log Events
Some events can span the end of one log file and continue onto the next log, and some of the current tools like ULS viewer could not handle easily. With such system, the log parsing is already done, and the queries are much faster.
-
Aggregate Log Sources
Using such system, an engineer would have the ability to shows events from multiple aggregate sources, and to analyze events that may have started and caused by other dependencies, while manifested only at SharePoint where the error occurs. Some easy log aggregation candidates would include the IIS server logs per host along with windows event logs and SQL server logs.
ULS Logs
The Unified Logging System (ULS log) is the standard logging format used for SharePoint farms.
Location is Configurable by admin but default installation point to the SharePoint hive C:\Program files\Common Files\Microsoft Shared\Web Server Extensions\14 or 15 or 16 \LOGS\*.log
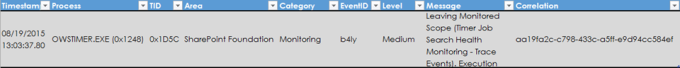
Process: Host
Executable running and causing the event.
TID: Process thread Id on that host.
Area: Component or application generating the event.
Event ID: Internal category Id per application.
The files rotate every 30 minutes by default.
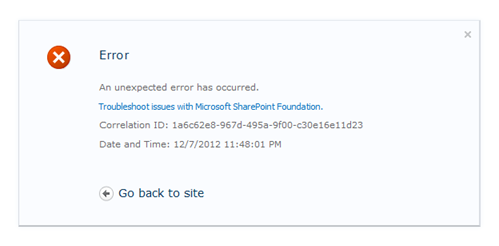
SharePoint Application Error Page
The SharePoint custom error page for 2010, 2013 and Office 365 looks like this.
Only a correlation Id is visible to the users and they are to report it to the support technician.
This can be very frustrating as a developer as you need to wait for hours and in some cases days before you get an answer .
Setting up ELK
- Install Java Runtime (JRE)
- Download the packages
(zip files) for each of the following and place each on a separate folder. Logstash , ElasticSearch, and Kibana.
- Edit the configuration file for each package for your environment (Development configuration )
For simplicity we opted to use the file input module to perform in our limited development environment, yet you can steam the log files using from multiple source using any plugin, LumberJack is the most commonly used log streaming plugin.
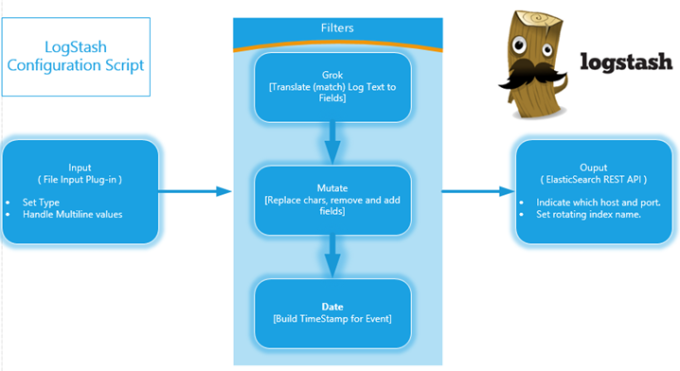
Details on the GROK filter syntax
The Grok filter is the main core component that tries to understand the schema of your unstructured log text and generates a temporary schema based object to be stored, indexed and later on queried upon.
There are a few formats for the log file and the date timestamp variations that puts a bit of a burden to collect construct a pattern to match all the value.
Sample Pattern
SP_ULS_FMT1 (?<sptimestamp>%{MONTHNUM}/%{MONTHDAY}/%{YEAR}%{HOUR}:%{MINUTE}:%{SECOND}\*?*)%{SPACE}%{PROG:sp_process}\(%{BASE16NUM:sp_pid}\)%{SPACE}%{BASE16NUM:sp_tid}%{SPACE}\t+%{DATA:sp_area}%{SPACE}\t+%{DATA:sp_category}%{SPACE}\t+%{DATA:sp_eventid}\t+%{SPACE}%{WORD:severity}%{SPACE}%{DATA:sp_eventmessage}%{SPACE}%{UUID:correlationid}%{SPACE}
You can see the full configuration script on the GitHub repo
https://github.com/Gergues/SharePoint-ELK
Building the Dashboard: Kibana Visualization
The Kibana configuration is fairly simple and all constructed through the UI. The Configuration of each of those elements is stored in the elasticSearch storage as an index named (.kibana).
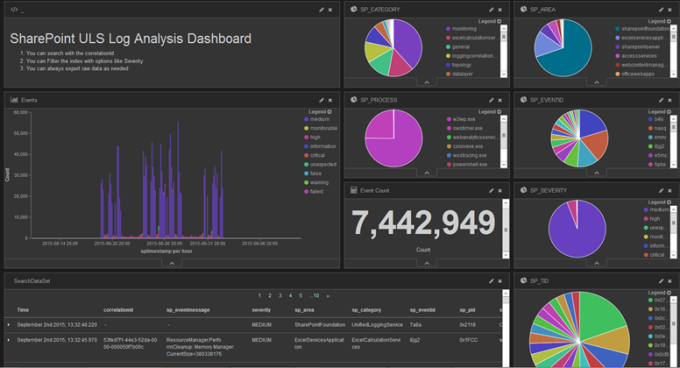 The dashboard is made of some smaller components, mainly charts, and widgets, that target a specific measurement against the index.
The raw data of each element can be displayed and extracted as csv file.
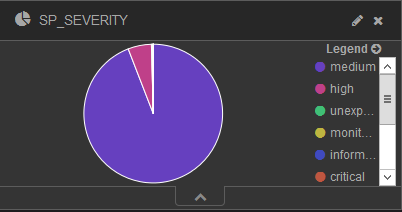
A Severity chart, is simply a vector of the unique elements in the field SP_SEVERITY describing the event severity level.
The whole dashboard is dynamically rendered and filtered via the queries you select
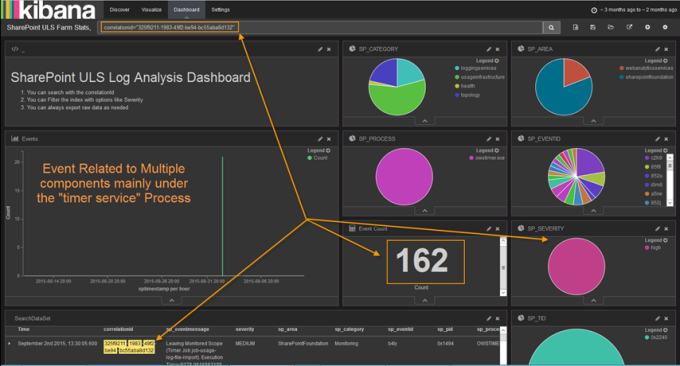
This sample shows the event correlation id with showing the severity level and the total count of events that happened along with the components
Full Configuration scripts
You can find the full configuration scripts to get you started here.
https://github.com/Gergues/SharePoint-ELK
Limitations
ELK inside JVM instances (Java Virtual Machine), so you are bound by the limits of that particular instance. As with any Java based process you can tweak
free memory and heap allocation parameters to get the best throughput, yet the optimal performance will be achieved by using clusters of the service, and that is where shard storage shine.
Improvements
-
Aggregate Log sources in dashboards
As a next natural enhancement for this project, IIS Logs on all servers, windows log and SQL Server logs as well as firewall and or load balancers.
-
Security
- You can start implementing some security over this system, not that in our sample system. Initially users don’t have access to the Search API directly but only via Kibana (the visualization layer) this is the first measure you can take.
- You can also implement an IIS or Apache proxy to implement authentication and authorization with any access control.
- You can use one of the commercial products (Shield and Marvel) from Elastic.Co
-
Scalability
This system is designed to be very highly distributed and available, with multiple node and clusters, (only keep the elastic nodes in the same geography to reduce latency). But you can have multiple hosts the logstash role, kibana role or all of them.
References
- Elasticsearch : https://www.elastic.co/products/elasticsearch
- LogStash : https://www.elastic.co/products/logstash
- Kibana : https://www.elastic.co/products/kibana
- ELK guides : https://www.elastic.co/guide/en/found/current/elk-and-found.html
- Guides on using Kibana : https://www.timroes.de/2015/02/07/kibana-4-tutorial-part-1-introduction/
- Grok Debug Tool : http://grokdebug.herokuapp.com/
- The full configuration scripts: https://github.com/Gergues/SharePoint-ELK